Eyeon:Manual/Fusion 6/Display Views/View Types
From VFXPedia
[ Main Manual Page ]
- Introduction
- Types of Display Views
- Context Menu
- Displaying an Image
- Position and Layout
- Panning and Scaling the Image
- Previews
- Onscreen Controls
- Toolbars
- A and B Buffers
- Subviews
- View Types
- Choosing Color Channels
- The 3D View
- Quad Display Mode
- Effects Masks
- Guides
- Look Up Tables (LUTS)
- View Options and Preferences
- Status Bar Information
- General Display Options
- Display View Label
Contents |
View and Sub View Types
As well as showing images, views can be changed to show a variety of different bits of information about the image. Not all views are valid at all times. For examples, the 3D viewer is not available for a 2D tool and many of the viewers are only valid for subviews.
Changing The View Type
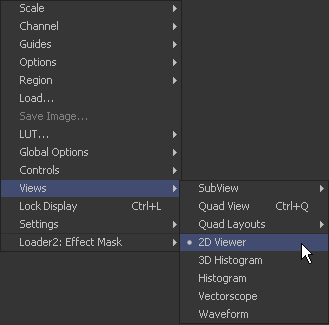
To change the View Type, open the display view's context menu and select the desired type from the view's submenu.
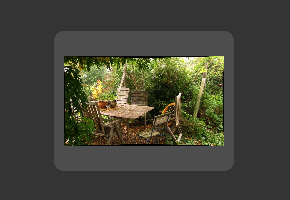
2D Viewer
The 2D Viewer is the basic 2D display view for showing images. When used as a subview, a different tool than the one used in the main view can be displayed by dragging and dropping the tool into the subview. This is the only subview type that is not slaved, showing the same tool that is displayed in the main view.
3D Image Viewer
The 3D Image Viewer is the basic 3D display view, available when viewing a tool from the 3D category.
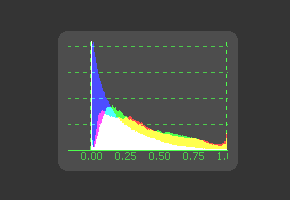
Histogram
The Histogram is an analysis tool that can be used to identify problems with contrast and the dynamic range in an image. This is essentially a graph that shows the frequency distribution of colors in the image. The horizontal axis shows the colors from black to white. The vertical axis shows the number of pixels in the image that occur at each level. Histograms are excellent tools for examining the overall contrast and distribution of colours in an image. As of Fusion 5.2, the Histogram viewer will also show out-of-range colours found in floating point images.
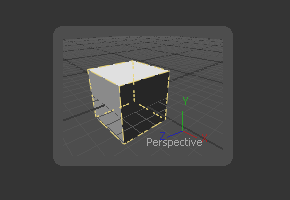
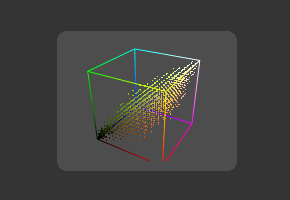
3D Histogram
This more advanced histogram type shows the color distribution in an image within a 3D cube. One advantage to 3D Histogram is that it can accurately represent the out-of-range colors commonly found in floating point and high dynamic range images. Navigate the 3D cube like any other 3D view (Alt-MMB to rotate).
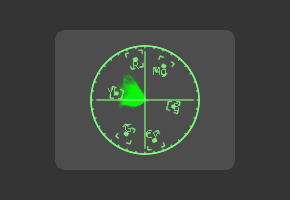
Vectorscope
The Vectorscope duplicates the behavior of a specific type of video test equipment, displaying a circular graph that helps to visualize chrominance signals.
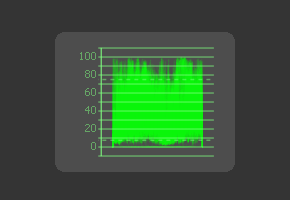
Waveform
The Waveform duplicates the behavior of a specific type of video test equipment, displaying a line or bar graph that helps to visualize the voltage, or luminance, of a broadcast signal.
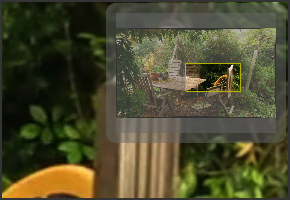
Navigator
The Navigator can only be used in a subview. It provides a small overview of the entire image, with a rectangle that indicates the portion of the image that is actually visible in the main display view. This is useful when zooming in on an image in the main view.
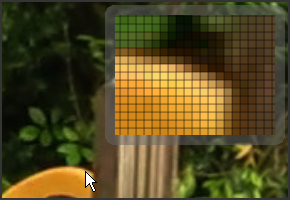
Magnifier
The Magnifier can only be used in a subview. It shows a zoomed-in version of the pixels under the mouse pointer in the main view.
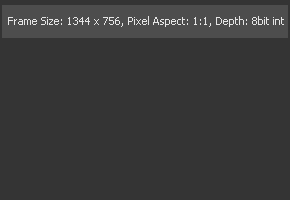
Image Info
The Image Info view can only be used in a subview. The image info tab shows a horizontal bar across the top of the image with information about the frame size, pixel aspect and color depth of the viewed image.
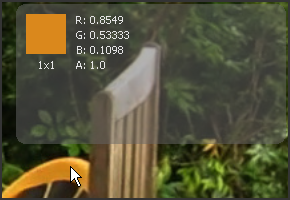
Color Inspector
The Color Inspector can only be used in a subview. The color inspector shows information about the color channels of the pixel under the mouse pointer. It will show all channels present, even the auxiliary channels such as Z buffer, XYZ normals and UV mapping channels.
The color is not sampled from a specific pixel, but rather it is sampled from several pixels. The default setting will sample from a 3 x 3 array of pixels around the mouse pointer. This can be changed by opening the View panel in the preferences and changing the value of the Color Picking Area Size.
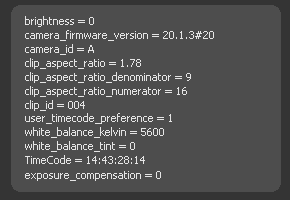
Metadata
Depending on the amount of metadata in your image this might present a wealth of information.
| The contents of this page are copyright by eyeon Software. |
