
< Previous | Contents | Next >
Determines the resolution of the color cube.
NOTE: Higher resolutions yield more accurate results but are also more memory and computationally expensive.
NOTE: Higher resolutions yield more accurate results but are also more memory and computationally expensive.
NOTE: Higher resolutions yield more accurate results but are also more memory and computationally expensive.
Typical Size settings for color cubes are 33 (33 x 33 x 33) or 65 (65 x 65 x 65). These numbers are the samples on each side of the cube. A 33 x 33 x 33 cube has around 35,937 color samples.
Settings Tab
The Settings tab in the Inspector is also duplicated in other LUT nodes. These common controls are described in the following “The Common Controls” section.
The Common Controls
LUT nodes share a number of identical controls in the Inspector. This section describes controls that are common among LUT nodes.
![]()
Inspector
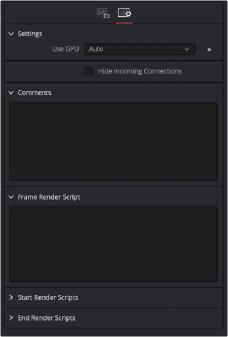
Common LUT Settings Inspector
Settings Tab
The Settings tab in the Inspector can be found on every tool in the LUT category. The controls are consistent and work the same way for each tool, although some tools do include one or two individual options, which are also covered here.
The Use GPU menu has three settings. Setting the menu to Disable turns off hardware-accelerated rendering using the graphics card in your computer. Enabled uses the hardware. Auto uses a capable GPU if one is available and falls back to software rendering when a capable GPU is not available.
Enabling this checkbox can hide connection lines from incoming nodes, making a node tree appear cleaner and easier to read. When enabled, empty fields for each input on a node are displayed in the Inspector. Dragging a connected node from the node tree into the field hides that incoming
connection line as long as the node is not selected in the node tree. When the node is selected in the node tree, the line reappears.
The Comments field is used to add notes to a tool. Click in the empty field and type the text. When a note is added to a tool, a small red square appears in the lower-left corner of the node when the full tile is displayed, or a small text bubble icon appears on the right when nodes are collapsed. To see the note in the Node Editor, hold the mouse pointer over the node to display the tooltip.
![]()
Three Scripting fields are available on every tool in Fusion from the Settings tab. They each contain edit boxes used to add scripts that process when the tool is rendering. For more details on scripting nodes, please consult the Fusion scripting documentation.