< Previous | Contents | Next >
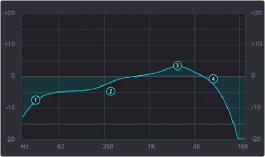
A graph at the top shows a curve with handles that correspond to each of the enabled EQ bands listed below. You can drag any numbered handle to boost or attenuate the range of frequencies governed by that band, using whatever type of equalization that band has been set to.
The EQ graph with user-draggable handles
Dragging the numbered handles on this graph in turn modifies the parameters of the corresponding band, and changing each band’s parameters will also alter the EQ graph, which serves the additional purpose of providing a graphical representation of the equalization being applied to that track.
![]()
Bands 1 and 4
The outer two sets of band controls let you make high-pass and low-pass adjustments, if necessary.
— Band enable button: Turns each band of EQ on and off.
— Band filter type: Bands 1 and 4 can be switched among six specific filtering options
for processing the lowest or highest frequencies in the signal. These include (from top to bottom): Lo-Pass, Lo-Shelf, Bell, Notch, Hi-Shelf, and Hi-Pass.
— Freq: Adjusts the center frequency of the EQ adjustment.
Bands 2 and 3
The middle two sets of band controls let you make a wide variety of equalization adjustments.
— Band enable button: Turns each band of EQ on and off.
— Band filter type: Bands 2–3 can be switched among four different filtering options (from top to bottom) Lo-Shelf, Bell, Notch, and Hi-Shelf.
— Frequency: Adjusts the center frequency of the EQ adjustment.
— Gain: Adjusts the amount by which the affected frequencies are affected. Negative values attenuate those frequencies, while positive values boost those frequencies.
— Q Factor: Adjusts the width of affected frequencies. Lower values include a wider range of frequencies; higher values include a narrower range of frequencies.