< Previous | Contents | Next >
Tips for Properly Shooting a Color Chart
The results you get using Color Match are completely dependent on how the charts were shot in the field. If the charts were properly shot, you’ll get great results. If the charts were improperly shot, the results will be unpredictable.
To get the best results using Color Match, adhere to the following guidelines:
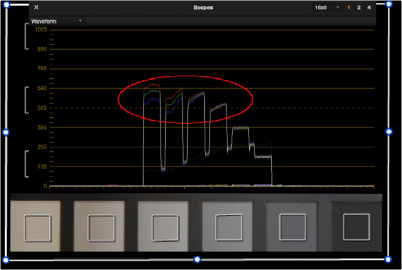
— The chart must be lit evenly such that the lighting on each patch is the same intensity (level) and color. Any shadows or changes in lighting color across the chart will result in Color Match trying to compensate for these changes, and an inaccurate match will result. When viewing a chart being lit prior to a shoot shooting via a waveform monitor, the top of each individual patch as seen on the scope should appear as a rectangle with a “flat top.”
![]()
Poorly lit chart with irregularly topped waveforms
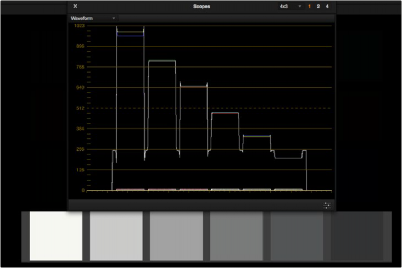
Well lit chart with flat-topped waveforms
— No patches on the chart should be clipped in any of the RGB color channels. A clipped channel will force Color Match to use incorrect RGB values, and the resulting match will be inaccurate.
— The white patch on the recorded chart should be captured between 70–95 IRE/percent. Correct exposure is essential to getting a good result, and while Color Match does allow for some adjustment via the White Level option, this will only give accurate results if the original chart is shot so that the white patch sits within the 70–95 IRE/percent range when viewed on a waveform monitor. It is not recommended that a white patch be shot with a signal level above 95 IRE/ percent, since this usually means that one of the RGB channels is close to or actually clipping which will cause an inaccurate match.
— The Source Gamma setting must be set to match the encoded OETF (opto-electrical transfer function, or gamma) of the recorded image. To be able to create an accurate adjustment, the Color Match function requires image data that is scene linear (linear to light). Most captured or recorded image data is encoded with a tone curve (gamma curve) to maximize the efficiency of the bit depth being used, and different cameras use different gamma curves to maximize the image data from different sensors. Since the Color Match algorithm converts image data into a scene linear space before creating an adjustment, it needs to undo the gamma curve created by the camera
or debayering process. If the wrong Source Gamma setting is selected in the Match Color palette, then the data will not be linearized correctly and the resulting match will be inaccurate.
— Lighting in the scene with an unusual spectral response or a strong color cast can cause an inaccurate match. Scenes lit with lights that have an unusual spectral response (such as cheap fluorescent bulbs, cheap LED lighting, or mercury vapor fixtures that exhibit a very narrow or spiky spectral power distribution) can cause metameric errors in both the camera’s response and the Color Match function, resulting in the creation of an inaccurate adjustment. The most accurate results are obtained when the scene uses lighting with a chromaticity that is close to the black body locus (with a highly correlated color temperature) and a relatively smooth spectral power distribution. In other words, use high-quality lighting that doesn’t have spikes in specific parts of the spectrum.
— Large differences between the color temperature of the lighting shining directly on the chart and ambient lighting elsewhere in the scene can cause perceptual errors. Often the problem is one of perception and not an incorrect color adjustment. For example, outdoor scenes being artificially lit with instruments shining extremely warm light (low color temperatures of 3200K or less) but that have cooler ambient lighting may appear overly blue if matched with a Target Color Temp
![]()
of 6500K. This happens because the chart under direct lighting is lit at the lower (yellower) color temperature, but areas of the scene in shadow are much cooler because of the ambient “blue” light from the sky; the result is an automatic color adjustment that’s correct for the chart, but exaggerated in the background.