< Previous | Contents | Next >
Sampling Images to Place Control Points on Curves
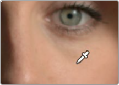
Another way you can add control points to curves is to move the pointer to the Viewer, and click to sample a color value and place a control point at the position on the currently open curve that corresponds to that value. This works with Custom, Hue, and HSL curves.
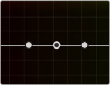
Clicking on a feature of the image
Creates a control point on the currently open curve
Showing Picker RGB Values
While you’re dragging the pointer over the Viewer and looking for a feature to sample, you can enable a tooltip that shows you the RGB Value of the pixel under the pointer by right-clicking the Viewer and choosing Show Picker RGB Value to toggle this feature on and off. When you turn this feature on, the Show RGB Picker Values In submenu in the Viewer’s option menu has options for displaying either 8- or 10-bit tristimulus values.
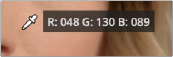
The color picker tooltip
that appears when you turn on Show RGB Picker Values
Curves Histograms
The Custom curves and HSL curves all show a histogram that represents the input of the currently selected Correction node, which you can use to guide your adjustments. The Histograms submenu of the Curves palette’s Option menu lets you choose to disable these histograms, or to switch the histograms between showing the input or the output of the node. If you switch to Output, the
![]()
histograms will update to show you the result of your adjustments, at the expense of seeing the image data that the curve is actually working upon.
The Custom curves show a YRGB histogram:
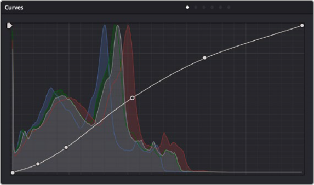
The histogram appearing underneath the Custom Curves shows a YRGB histogram analysis