< Previous | Contents | Next >
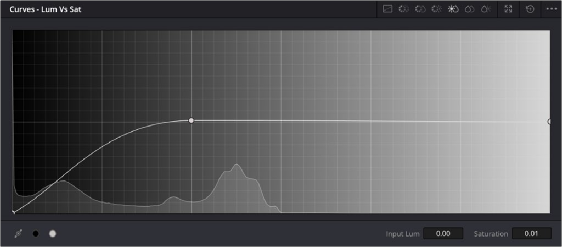
The Lum vs. Sat curve is similar to the Custom curves in that alterations to the saturation of an image are based on user-definable ranges of image tonality, rather than hue. In the following example,
the Lum vs. Sat curve is being used to decrease selectively the saturation of everything falling into the highlights and shadows of the image, while increasing the saturation of everything within the midtones.
In the following example, a vividly saturated treatment results in shadows that seem artificially colorful. Using the Lum vs. Sat curve, it’s easy to gradually desaturate everything below a certain range, with a nice smooth falloff.
This is an outstanding curve to use for creative effect, for example, slightly boosting saturation within the midtones while reducing saturation in the shadows to increase the depth of the darkest portions of the image. It’s also a great curve to use to solve QC violations. For example, if you have illegal saturation in the highlights of an image, you can use the Lum vs. Sat curve cleanly and smoothly to lower the specific values that are causing problems.


![]()
Selective desaturation in the shadows and highlights using the Lum vs. Sat curve; Right–original image, Left–altered image
Sat vs. Sat
The Saturation vs. Saturation curve lets you selectively manipulate image saturation within specific regions defined by the image’s original image saturation. Control points added to the left of this curve affect areas of progressively lower saturation, effectively letting you increase or decrease the saturation of lower-saturated features. Control points added to the right affect areas of progressively higher saturation, letting you increase or decrease the most saturated features of an image.