< Previous | Contents | Next >
When using the Loudness meters to do a structured analysis of your mix to determine QC adherence, a group of controls let you determine when analysis begins and ends.
— Lock Metering to Transport: This setting is found in the compound meter option menu. When enabled, all loudness metering analysis is automatically reset whenever you move the playhead to another location in the Timeline. This is useful when you’re spot-checking different parts of your mix, or working on a particular scene. Uncheck this option if you want the measurement of playback to that point in the Timeline to remain.
— Absolute Scale: An absolute measure of the selected scale type.
— Pause and Reset buttons: When you’re doing a formal analysis of your mix, the Reset button lets you reset all currently accumulated analyses, and the Start button initiates loudness value accumulation. If you need to stop playback briefly to do something else, you can click Pause, and then click Resume when you’re ready to continue the analysis.
Offline Loudness Analyzer
Users also have the ability to analyze an audio file’s loudness offline. This is a fast way to measure loudness in imported audio files or bounced mixes.
— Right-click the file in the Timeline, and choose Analyze Audio Level from the contextual menu. A dialog box displays the available options for measurement.
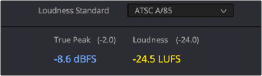
All of the measurements available in the real-time loudness meter are accessible in the drop-down menu inside the Analyze Audio Level panel. When the analyzer mode is chosen, the target measurements for that mode will display next to the reading in parenthesis. Once you have clicked the analyze button, the results will display in the panel next to the chosen mode’s target measurement values.
Visualizing Loudness Monitoring
Select the audio file, choose the desired analyzer mode, in this case EBU R128, and click analyze.
When you show the track of a Main bus in the Timeline, as long as the track is high enough (ahem, tall enough), you can show or hide a series of “Loudness History” curves to visualize the loudness analysis of the mix on that bus over the duration of the mix.
![]()
The available curves are:
— Integrated: A thick curve shows the averaged “integrated” loudness analysis of the current mix, which is a measurement that’s taken from the beginning to the end of playback. This graph is the primary gauge of whether or not measured loudness is acceptable. The color of each segment of this curve indicates whether that part of the mix is “to spec.” Blue indicate loudness levels that are below tolerance, yellow indicates loudness values that are within tolerance, and red indicates
loudness values that are above tolerance. By evaluating the colors of the curve, you can easily spot which parts of your mix might need adjustment to meet the necessary specification.