< Previous | Contents | Next >
— Press Shift-V.
— Right-click in a viewer and choose Views > SubView > Swap from the contextual menu.
Viewer and Subview Types
Viewers can be changed to show a variety of different information about the image, but not all view types are available at all times. For example, the 3D Viewer is not available for a 2D node, and some of the measurement viewers are available only as subviews. Below is detailed information about the different view types available.
Navigator
![]()
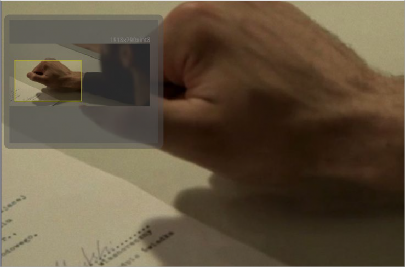
The Navigator can only be used in a subview. It provides a small overview of the entire image, with a rectangle that indicates the portion of the image that is actually visible in the main viewer. This is useful when zooming in on an image in the main view.
Magnifier
The Navigator subview for panning the image while zoomed in
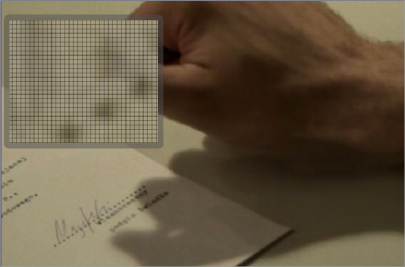
The Magnifier can be used only in a subview. It shows a zoomed-in version of the pixels under the cursor in the main viewer.
The Magnifier subview used to view a zoomed- in version of the image
2D Viewer
The 2D Viewer is the default type for showing images. When used as a subview, a different node than the one used in the main viewer can be displayed by dragging the node into the subview.
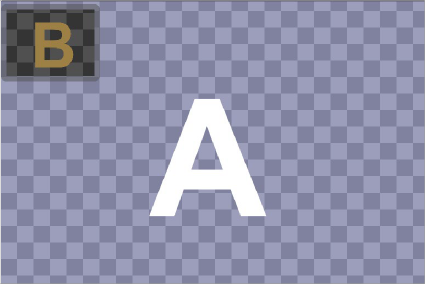
This is the only subview type that is not just a different view of the same node in the main viewer.
3D Image Viewer
![]()
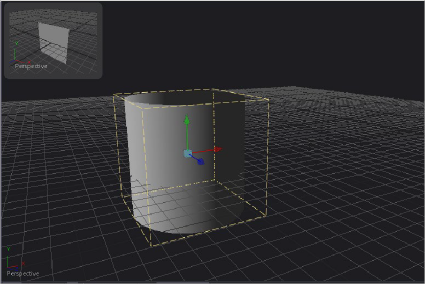
The 3D Image Viewer is available when viewing a node from the 3D category.
The subview used as another viewer
3D Histogram
A 3D Image Viewer as a subview
The more advanced 3D Histogram Viewer shows the color distribution in an image within a 3D cube. One advantage to a 3D Histogram is that it can accurately represent the out-of-range colors commonly found in floating-point and high-dynamic-range images. It can also be used to look at vector images like position, normal, velocity, and so on.
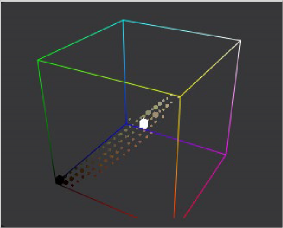
The 3D Histogram Viewer type
for evaluating
out-of-range colors
— Hold down the Option key, and drag left or right using the middle mouse button.
— Hold down the middle and right mouse buttons while dragging.
Color Inspector
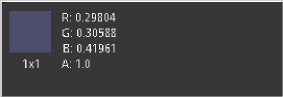
The Color Inspector can only be used in a subview. The Color Inspector shows information about the color channels of the pixel under the cursor. It will show all channels present, even the auxiliary channels such as Z buffer, XYZ normals, and UV mapping channels.
Histogram
The Color Inspector subview for evaluating colors in an image
![]()
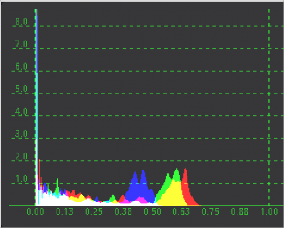
The Histogram Viewer is an analysis node that can be used to identify problems with the contrast and dynamic range in an image. The graph shows the frequency distribution of colors in the image, including out-of-range colors in floating-point images. The horizontal axis shows the colors from shadows to highlights. The vertical axis shows the number of pixels in the image that occur at each level.
The Histogram Viewer type for evaluating the contrast and color cast in an image
The Histogram Viewer will also display gradient information. You can use the From Image and Perturb modifiers to output gradients. If you need to see the gradient represented in a histogram, drag the modifier’s title bar into the viewer.
Image Info
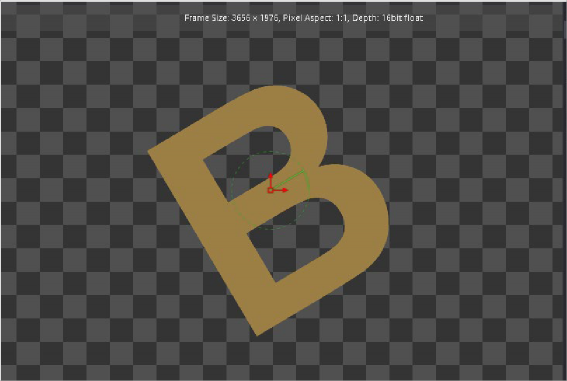
The Image Info view can only be used in a subview. The Image Info tab shows a horizontal bar across the top of the image with information about the frame size, pixel aspect, and color depth of the viewed image.
![]()
The Image Info subview for viewing size, pixel aspect, and color depth information
Metadata
The content of this subview is based entirely on the amount of metadata in your image. Most Loaders will give the color space and file path for the image. Much more information can be displayed if it exists in the image.
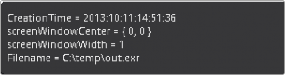
The Metadata subview for viewing embedded metadata
Vectorscope
The Vectorscope Viewer duplicates the behavior of a specific type of video test equipment, displaying a circular graph that helps to visualize the intensity of chrominance signals.