< Previous | Contents | Next >
The Graph, Header, and Toolbar
The Spline Editor has three main working areas: the graph, header, and toolbar. On the left side of the Spline Editor is the header, which shows a list of animated parameters. The majority of the panel is taken up by the splines displayed in the graph area, and a toolbar runs along the bottom, providing a variety of ways to manipulate the splines.
Graph
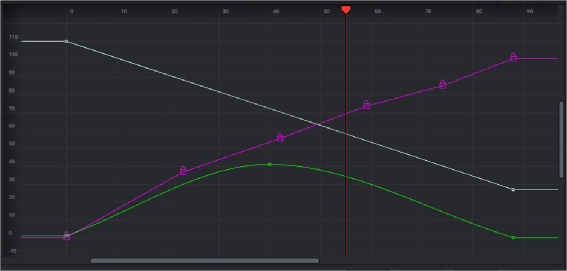
The graph is the largest area of the interface. It is here that you see and edit the animation splines. There are two axes in the graph. The horizontal axis represents time, and the vertical axis represents the spline’s value. A thin bar, called the playhead, runs vertically through the graph to represent the current time as it does in the Timeline Editor. You can drag the playhead to change the current time, updating the frame displayed in the viewers.
![]()
Removing a spline from a parameter removes the animation
Spline Editor Header
The header provides a mechanism for determining what splines are visible in the graph. It shows the name of each spline in the project beneath the tool that contains that parameter. The checkbox beside each name shows whether that spline is currently displayed in the graph and whether the spline can be edited.
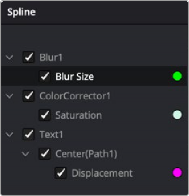
The Spline header