< Previous | Contents | Next >
Navigating Around the Spline Editor
It is often necessary to magnify and pan around the graph area to ensure that the splines you want to work on are visible. In general, scaling and panning the Spline Editor works the same as in all navigable parts of the Fusion interface. However, there are several unique functions to the Spline
Editor for controlling your view based on the height, width, and selection of multiple animation splines.
The most obvious navigation methods to use are the scale sliders and buttons located in the upper left of the Spline Editor panel.
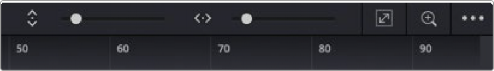
The Zoom Height and Zoom Width sliders, Fit button, and Zoom to Rectangle button can be used to navigate around the graph
![]()
Zoom Height and Zoom Width sliders let you change the height and width of the graph area.
![]()
The Fit button attempts to rescale the view so that all currently active splines fit within the graph.
![]()
The Zoom to Rectangle button (Command-R) allows you to draw a bounding box around the area of the graph you want centered and scaled.
![]()
— Place the mouse pointer over the rulers for the horizontal or vertical axis and drag to resize the graph on that axis only. The view is scaled centered on the original position of the pointer on the ruler.
![]()
Dragging in the Time Ruler scales the graph horizontally
— With the Spline Editor active, press the + and - keys on your keyboard to zoom in and out of the graph.
— You can also zoom to a specific control point by holding down the Command key and scrolling the middle mouse wheel. The mouse pointer location determines the area that gets magnified.
— Position the mouse pointer over the graph, and then hold down the middle mouse button. With the middle mouse button pressed down, click once on the left mouse button to zoom in and once on the right button to zoom out.