< Previous | Contents | Next >
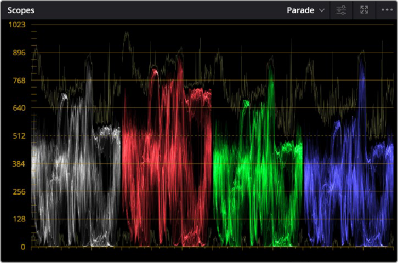
The Parade scope shows separate waveforms side by side that analyze the strength of individual video signal components. The Parade scope can be set to analyze RGB, YRGB, and Y’CBCR.
By showing a comparison of the intensity of the luma, red, green, and blue channels, the Parade scope makes it possible to detect and compare imbalances by comparing the relative heights of the RGB graphs in the highlights (the top of the R, G, and B graphs), shadows (the bottom of the R, G, and B graphs), and midtones (the middle of the R, G, and B graphs) for the purposes of identifying color casts and performing scene-by-scene correction.
When the YRGB channels are taken altogether, the bottom of all graphs indicates the black point of the image, while the tops of all graphs indicate the white point. It then follows that the difference between the height of the bottom and top of all graphs indicates the overall contrast ratio of the image you’re evaluating. Tall parade graphs indicate a wide contrast ratio, while short parade graphs indicate a narrow contrast ratio.
The Parade scope showing YRGB waveforms, with colorization and extents enabled
Vectorscope
![]()
Measures the overall range of hue and saturation within an image. Measurements are relative to a centered graticule that you can enable that’s overlaid on the scope, which provides a frame of
reference via crosshairs. DaVinci Resolve has a traditional vectorscope, the graph of which emulates a trace-drawn graph, with 75 percent color bar targets indicating the angle of each of the primary and secondary colors around the edge of the graph, and an optional skin tone reference graticule (otherwise known as the In-phase reference).
The Vectorscope can have Colorize enabled to show false color which lets you see which colors in the Viewer image are where in the video scope graph.
More saturated colors in the frame stretch those parts of the graph farther toward the edge, while less saturated colors remain closer to the center of the vectorscope, which represents 0 saturation. By judging how many parts of the vectorscope graph stick out at different angles, you can see how many hues there are in the image, with the specific angle of each part of the graph showing you which hues they are. Furthermore, by judging how well centered the middle of the vectorscope graph is relative to the