< Previous | Contents | Next >
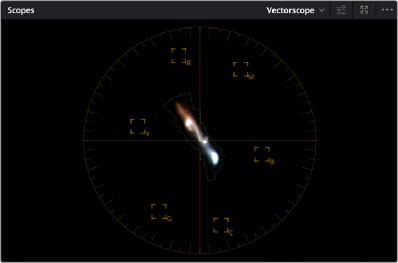
crosshairs, you can get an idea of whether there’s a color imbalance in the image. If the vectorscope graph is off-centered, the direction in which it leans lets you know that there’s a color cast (tint) in the image.
The Vectorscope shown in 2x mode, with combined highlights, mid-tones, and shadows extents
Histogram (RGB/YRGB parade histogram)
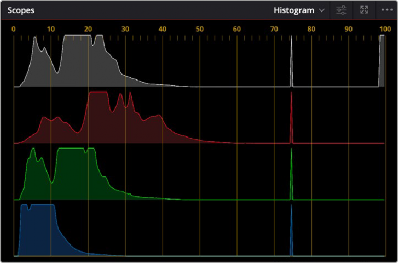
Displays a statistical analysis of how many pixels of each color channel lie at each percentage of tonality, plotted along a digital scale from 0 percent (black) to 100 percent (white). Comparing the left, middle, and right parts of the Y, R, G, and B graphs (Y is optional) lets you evaluate the color balance in the shadows, midtones, and highlights of the image.
![]()
The Histogram scope set to YRGB
Taken altogether, the left of all graphs indicates the black point of the image, while the right of all graphs indicate the white point. It then follows that the difference between the width of the left and right of all graphs indicates the overall contrast ratio of the image you’re evaluating. Wide histogram graphs indicate a wide contrast ratio, while narrow histogram graphs indicate a narrow contrast ratio.