< Previous | Contents | Next >
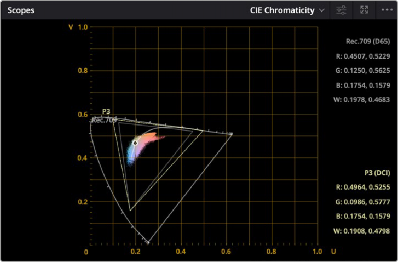
Most people who’ve had any exposure to color grading concepts are familiar with the traditional CIE 1931 horseshoe graph, which plots the portion of the spectrum visible to the human eye according to studies done in the late 1920s (subsequent studies have confirmed this analysis). The optional CIE 1976 uv graph is based on an updated color space (CIELUV) that was an attempt by the International Commission on Illumination (CIE) to create a more perceptually uniform graph of color. Whereas the CIE 1931 analysis visually exaggerates certain parts of a color graph, the CIE 1976 graph draws all parts of a color graph more or less proportionally to one another. Overall, neither analysis is more “correct” than the other, it’s simply a matter of what you prefer to look at.
The CIE 1976 scope showing both P3 and Rec. 709 gamuts
Panning and Zooming the Video Scopes
If you want to examine any part of a video scope’s graph in more detail, you can do the following:
— To zoom into a graph: Hold the Option key down, and roll the scroll control.
![]()
— To pan around a graph: Click and drag with the middle pointer button.
Customizing the Video Scopes
Once you’ve opened the video scopes, there are a variety of ways you can customize how the scopes look, and expose additional onscreen graticule information to help you measure what you need.
— To change the size of the Scopes window: Drag the lower right-hand corner to resize the Scopes window to the desired size.