< Previous | Contents | Next >
DaVinci Resolve contains CIE 1931 xy and CIE 1976 uv scopes, which let you see the current image analysis as a graph superimposed against a triangle that represents the tristimulus values of the color gamut you’re working within, along with an indication of the current white point. A label shows the currently selected gamut, with the specific coordinates of these Red, Green, and Blue values as well
as the White point, while the overall “horseshoe” shape represents the entire range of visible light, all plotted against an xy graph.
The white point ordinarily appears atop a curve along the center of the shape. This curve indicates the black body locus, along which the various color temperatures of an image’s white point correlate, from orange-ish warm to blue-ish cool. This black body locus corresponds to the color temperatures obtained by progressively heating carbon to different temperatures.
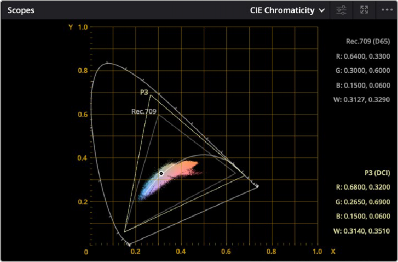
You also have the option of showing a second gamut triangle, in cases where you want to compare the current analysis to two different gamuts. This can be useful when you need to create deliverables in multiple gamuts, and you want to see which parts of the video signal are safe in all gamuts and which parts are exceeding the smaller of the two. When you do this, both gamuts are labeled, and the coordinates of the Red, Green, and Blue values of both gamuts are listed to the side.
The CIE 1931 xy scope showing both P3 and Rec. 709 gamuts
![]()
In a way, the Chromaticity scope is a 3D scope, but it’s drawn as if you’re looking down at the top of a 3D shape that plots every color value in an image in X, Y, Z space, but you can only perceive the 2D outline around the widest parts of this shape drawn on an X, Y plot. The graph does indeed represent every single value found within a 3D plot of the image data, but the triangle only indicates the widest “slice” of the current gamut and of this 3D shape within the mid-tones.
What this means is that while the Chromaticity scope’s graph gives you a rough idea of whether or not the current image is within gamut relative to your delivery spec, it’s not exact and it’s not foolproof, as part of the image data could fall within this wide triangle and yet overshoot the required gamut elsewhere in the highlights at the top or the shadows near the bottom of the 3D shape you’re looking down on. On the other hand, if any part of the graph does extend past the boundaries of the gamut triangle, then that definitely indicates a gamut violation.
You can add an additional gamut triangle in the scope settings in order to compare the color space you’re working in to another color space, for reference.