< Previous | Contents | Next >
The Vectorscope has the following options:
— Choose ALL to view the entire tonal range of the image as a Vectorscope graph analysis, or to selectively view just the shadows (Low), mid-tones (Mid), or highlights (High) of the image as a vectorscope graph analysis.
— A Colorize checkbox draws the different areas of these graphs with color taken from the image being analyzed, which makes it easier to see which part of the scope graph corresponds to which part of the image. With colorize turned off, graphs only appear white.
— An Extents checkbox draws an outline highlighting all graph excursions to unambiguously show you all overshoots and undershoots.
— A Combine checkbox lets you see simultaneous overlapping extents for the highlights, mid-tones, and shadows overlaid on one another.
— The Vectorscope slider makes that scope’s graph brighter or dimmer. Brighter graphs make it easier to see fine detail, but harder to see which parts of the graph are stronger and weaker.
— The Graticule slider makes that scope’s scale brighter or dimmer, making it more or less visible (or distracting) relative to the graph.
— Low Range and High Range sliders let you manually define the boundaries separating shadows from mid-tones and highlights. Low Range defaults to 0.30, and High Range defaults to 0.70.
— Show 2X Zoom zooms the vectorscope graph by 200%, making it easier to see fine detail and use the vectorscope with charts.
— Show Skin Tone Indicator checkbox shows a line at the traditional Inphase angle that is useful as a general guidepost for average skin tone hue.
![]()
— Show Graticule checkbox lets you show or hide the circular degrees indicator surrounding the outer edge and the cross hairs that indicate the center of the vectorscope.
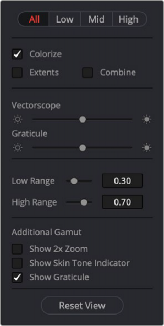
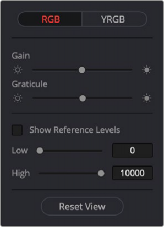
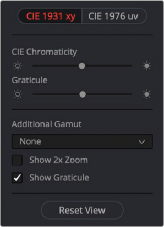
Options in the Vectorscope Options in the Histogram scope Options in the Chromaticity scope