< Previous | Contents | Next >
Each track and bus meter (with the exception of the Loudness meters) display RMS (root mean square) levels against a dB scale. A single line indicating the maximum value at any given moment in time is held briefly just above the current RMS levels, which appear as a solid bar extending from the bottom of the meter. RMS meters display a weighted “average” representation of the audio level that’s closer to the way audio is actually perceived, although not as accurate in measuring perceived loudness as the loudness meters discussed later in this section.
![]()
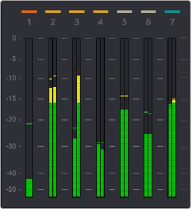
Track audio meters with different numbers of meters depending on that track’s audio mapping
The peak meter
at top
Each meter bar is color coded to indicate three different sound level “zones,” from low to medium (green) to moderately high (yellow) to very high (red).
Each meter is identified by the track number it represents (track names are not shown over track meters) as well as the color of that track.
Bus Meters
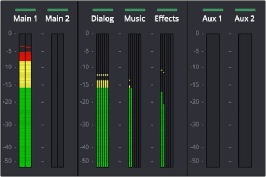
To the right of the track meters are the bus meters, in which all user-created mains and busses appear, separated by type, and each displaying the number of meters that corresponds to that track’s audio mapping. These meters allow you to monitor the sum of all tracks that have been routed to a particular bus, as you can on bus channel strips.
Bus meters for the Mains, Subs, and Aux busses